Bitcoin Slips Below Key Moving Averages, Sellers Hold Edge
BTC dropped to $76,229 today and sits under critical hourly MAs. Here's what buyers must reclaim to flip the script.
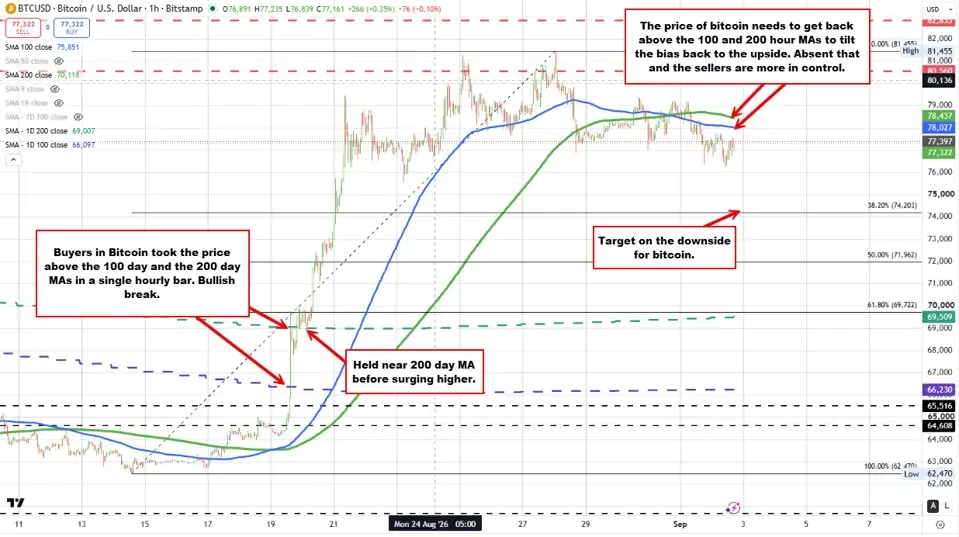
Bitcoin had a solid run off its late-June lows, but the rally is stalling out—and right now, sellers are calling the shots. The price dipped to $76,229 intraday and is currently trading near $77,148, sitting below both the 100-hour moving average at $78,025 and the 200-hour moving average at $78,436. Below those levels, the short-term bias is bearish. Simple as that.
The bull case looked real back on August 19, when BTC punched above its 100-day MA near $66,200 and its 200-day MA near $69,000 in a single session. Buyers followed through hard, pushing price all the way to $81,455 on August 28—the highest print since May. But that's where momentum died. The rally ran straight into a prior swing zone between $80,560 and $82,833, and it couldn't break through.
Read more Rising Bond Yields Could Squeeze Your Wallet Two Ways →
There's a bigger problem on the daily chart too. Bitcoin's full decline ran from an all-time high of $126,272 down to a June low of $57,735. The bounce since then has been meaningful, but it hasn't even cleared the 38.2% Fibonacci retracement at $83,916—the first real test of whether this is a genuine reversal or just a dead-cat bounce inside a larger downtrend. Buyers have fallen short every time.
To flip the script, Bitcoin needs to reclaim the $78,025–$78,436 moving-average zone and hold above it—not just spike through and reverse. After that, the next wall is the $80,560–$82,833 resistance band, followed by that $83,916 Fibonacci level. Clear all three and the bull narrative gets a lot more credible. Until then, fading bounces has been the winning trade.
Could this pullback be a brief pause before another leg higher? Sure, it's possible. But trade what you see, not what you hope. Watch the MAs, watch the resistance zones, and let the price action tell you when the balance of power actually shifts. Continue reading at Forexlive.